
Type of resources
Available actions
Topics
INSPIRE themes
Keywords
Contact for the resource
orgNameSNIG
Provided by
Years
Formats
Representation types
Update frequencies
Status
Service types
Scale
Resolution
geoDescCode
cartografia
geographicCoverage
geographicCoverageDesc
inspirecore
referenceDateRange
denominatorRange
resolutionRange
dataPolicy
openServiceType
dataType
dataFormat
-
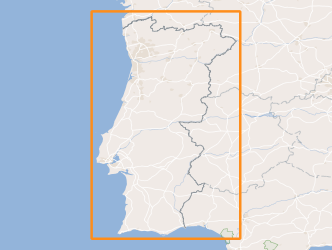
Nosologic map of the Grooved Carpet Shell in mainland Portugal. The health screening of the species population aims the identification and characterization of diseases affecting the Grooved Carpet Shell and their characterization both as to its epidemiology (incidence, prevalence and intensity of the disease), as to their impact on production. This information is intended to characterize the different production areas of the species from the health point of view.
-
Visualization service (WMS) from monthly mean air temperature, mean values of the period 1971-2000, obtained by multivariate regression with altitude and distance to the coast, explanatory variables, and ordinary kriging of residues.
-

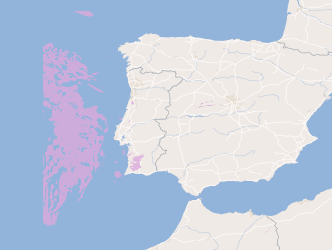
Within Portugal's National Biological Sampling Project (PNAB) a set of activities are conducted in the collection, management and use of biological data, collected from the registered commercial fleet in mainland Portugal (fisheries-dependent data) and several research surveys (independent fisheries data). These activities allow the assessment of the state of fishery resources, population structure, distribution and abundance of resources, diversity and dynamics of biological communities associated with the fishery resources and biological studies (growth, reproduction).This resource shows the geographic distribution of Norway lobster abundancy index (nr. individuals/hour) registered during the CRUSTACEOS2009 campaign in June 2009.
-

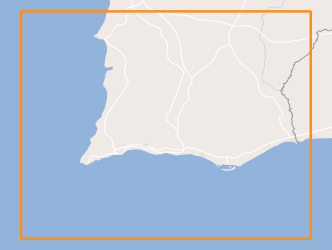
Nosologic map of the Japanese Shell in mainland Portugal. The health screening of the species population aims the identification and characterization of diseases affecting the Japanese Shell and their characterization both as to its epidemiology (incidence, prevalence and intensity of the disease), as to their impact on production. This information is intended to characterize the different production areas of the species from the health point of view.
-
WMS Three-hourly forecast of the surface pressure in the Atlantic region for the next 5 days (ECMWF)
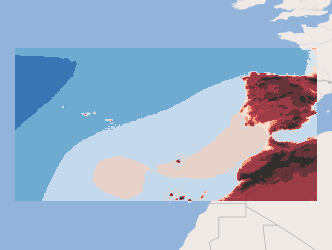
Three-hourly forecast maps of surface pressure in Pascal in the Atlantic region, generated daily from ECMWF data, with forecasts every 3 hours of the current day from 00h to the next 120 hours. This visualization service includes the individual layers and also a multidimensional layer that brings all of them together.
-
Three-hourly forecast maps of medium cloud cover in percentage in the Iberian Peninsula, generated with the AROME model at 00UTC for the next 48 hours. This visualization service includes the individual layers and also a multidimensional layer that brings all of them together.
-
Visualization service (WMS) from monthly total precipitation, during the period 1971-2000, obtained by multivariate regression with altitude and distance to the coast, explanatory variables, and ordinary kriging of residues.
-
Within Portugal's National Biological Sampling Project (PNAB) a set of activities are conducted in the collection, management and use of biological data, collected from the registered commercial fleet in mainland Portugal (fisheries-dependent data) and several research surveys (independent fisheries data). These activities allow the assessment of the state of fishery resources, population structure, distribution and abundance of resources, diversity and dynamics of biological communities associated with the fishery resources and biological studies (growth, reproduction).This resource shows the geographic distribution of small-spotted catshark abundancy index (nr. individuals/hour) registered during the CRUSTACEOS2014 campaign in June 2014.
-
Visualization service (WMS) from Map of the monthly total precipitation, during the period 1971-2000, obtained by multivariate regression with altitude and distance to the coast, explanatory variables, and ordinary kriging of residues.
-
Visualization service (WMS) from Map of the monthly mean air temperature, mean values of the period 1971-2000, obtained by multivariate regression with altitude and distance to the coast, explanatory variables, and ordinary kriging of residues.